.jpg)

Maritime is a high-cost, high-variance business. The same vessel can be profitable on one route and marginal on another—simply because of weather, port congestion, bunker prices, charter terms, cargo availability, hull condition, or a small delay that snowballs into days. That’s exactly why “gut feel” alone doesn’t scale anymore.
Maritime analytics turns day-to-day vessel data (AIS, noon reports, engine data, weather, port calls, maintenance history, charter terms, market rates) into decision-grade insight—so leaders can answer questions like:
This blog is written for maritime teams who want a practical, real-world view of how analytics drives strategic fleet decisions—supported by live examples and visual data.
Around 80% of global trade volume moves by sea, which makes shipping central to supply chains—and extremely exposed to shocks and volatility
At the same time, the industry is under strong pressure to reduce emissions; shipping contributes nearly 3% of global human-caused CO₂ emissions (and methane is a growing issue in some fuel pathways).
On top of market cycles, new rules and cost mechanisms are turning emissions into a balance-sheet item. For example, the EU Emissions Trading System (EU ETS) is being phased into shipping with a ramp-up from 40% → 70% → 100% coverage across 2024–2026 emissions years.
That combination—volatile operations + cost pressure + emissions accountability—is exactly where analytics becomes strategic.
Think of maritime analytics as a ladder:
The real value starts at level 3 and 4—where analytics becomes a decision engine, not just reporting.
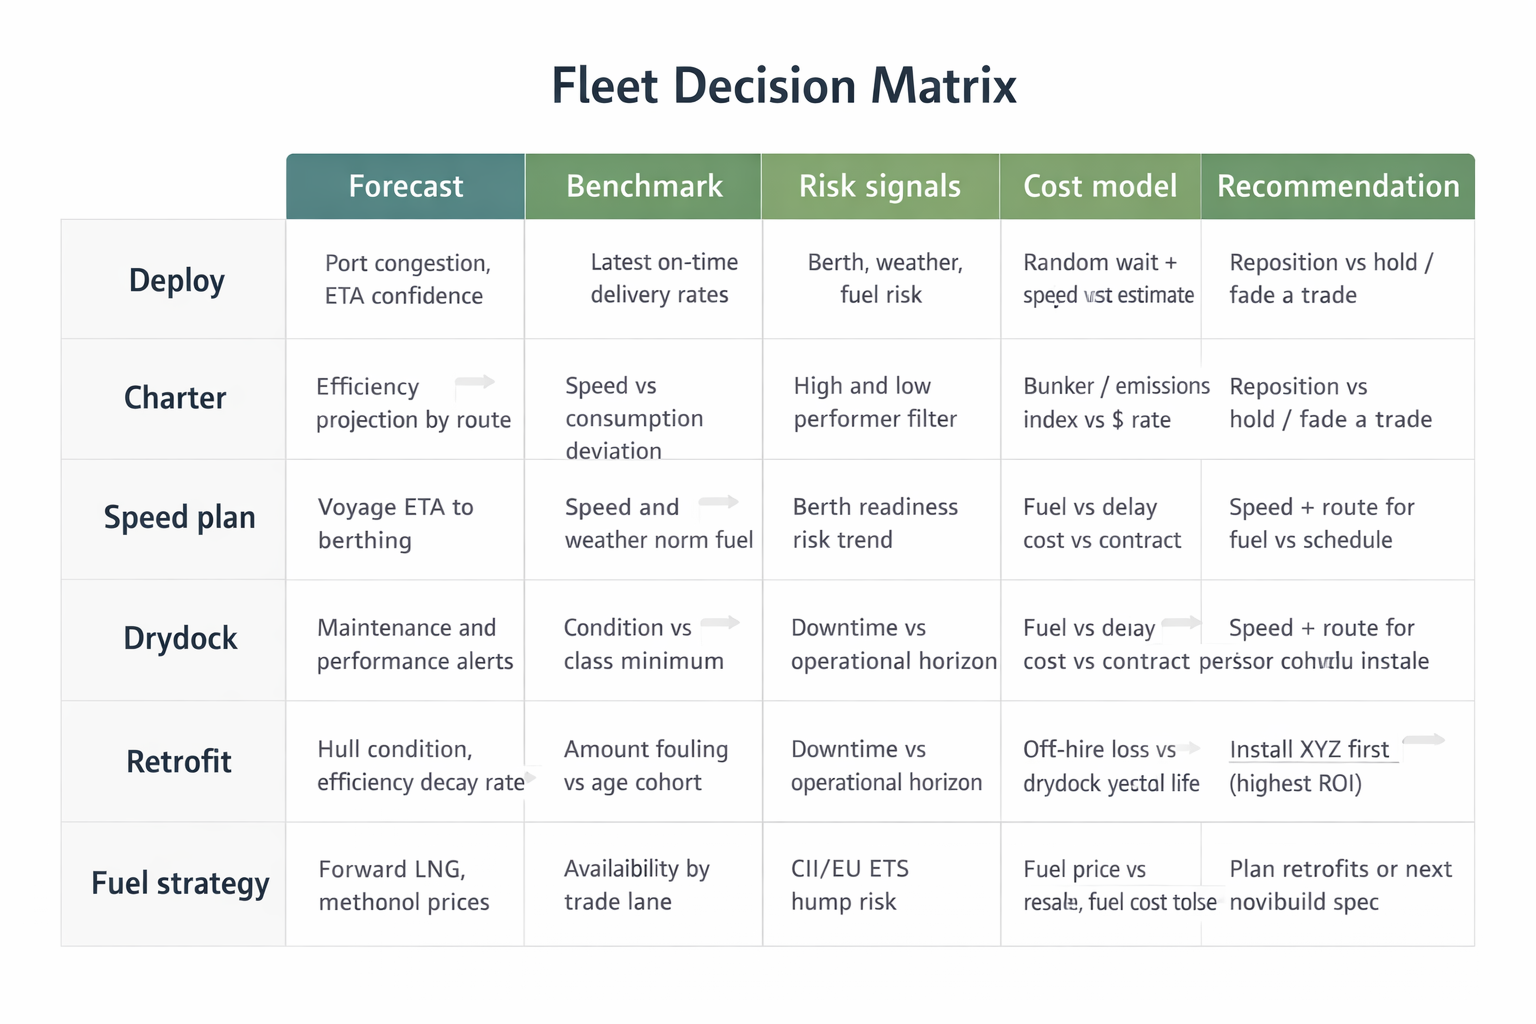
Below is a simple way to connect analytics to strategic decisions.
Strategic question: Where should we position each vessel to maximize earnings and minimize avoidable cost?
Analytics signals that matter:
Decision outcomes:
AIS data analytics is explicitly used for shipping business decision-making, including chartering and freight markets, and becomes more powerful when enriched with other data sources beyond AIS alone.
Strategic question: Which vessels are the best performers on a given route, and which are likely to underperform?
Analytics signals:
Live example:
A published industry case describes a charterer using performance analytics to rank vessels, identify top and bottom performers, and adjust chartering choices—reporting over $25M savings after optimizing vessel selection and maintenance timing.
(As with any vendor case, treat the magnitude as context-dependent—but the decision logic is real and widely applicable.)
Strategic question: What should we fix now, what can wait, and what assets are no longer worth heavy spend?
Analytics signals:
Decision outcomes:
Ship ordering behaviour itself is an analytics problem—driven by regulation outlook, fuel availability, resale value expectations, and trade requirements.
A recent DNV Alternative Fuels Insight update showed:
That tells a strategic story: uncertainty and capital discipline are rising, even while alternative fuel capability remains important.
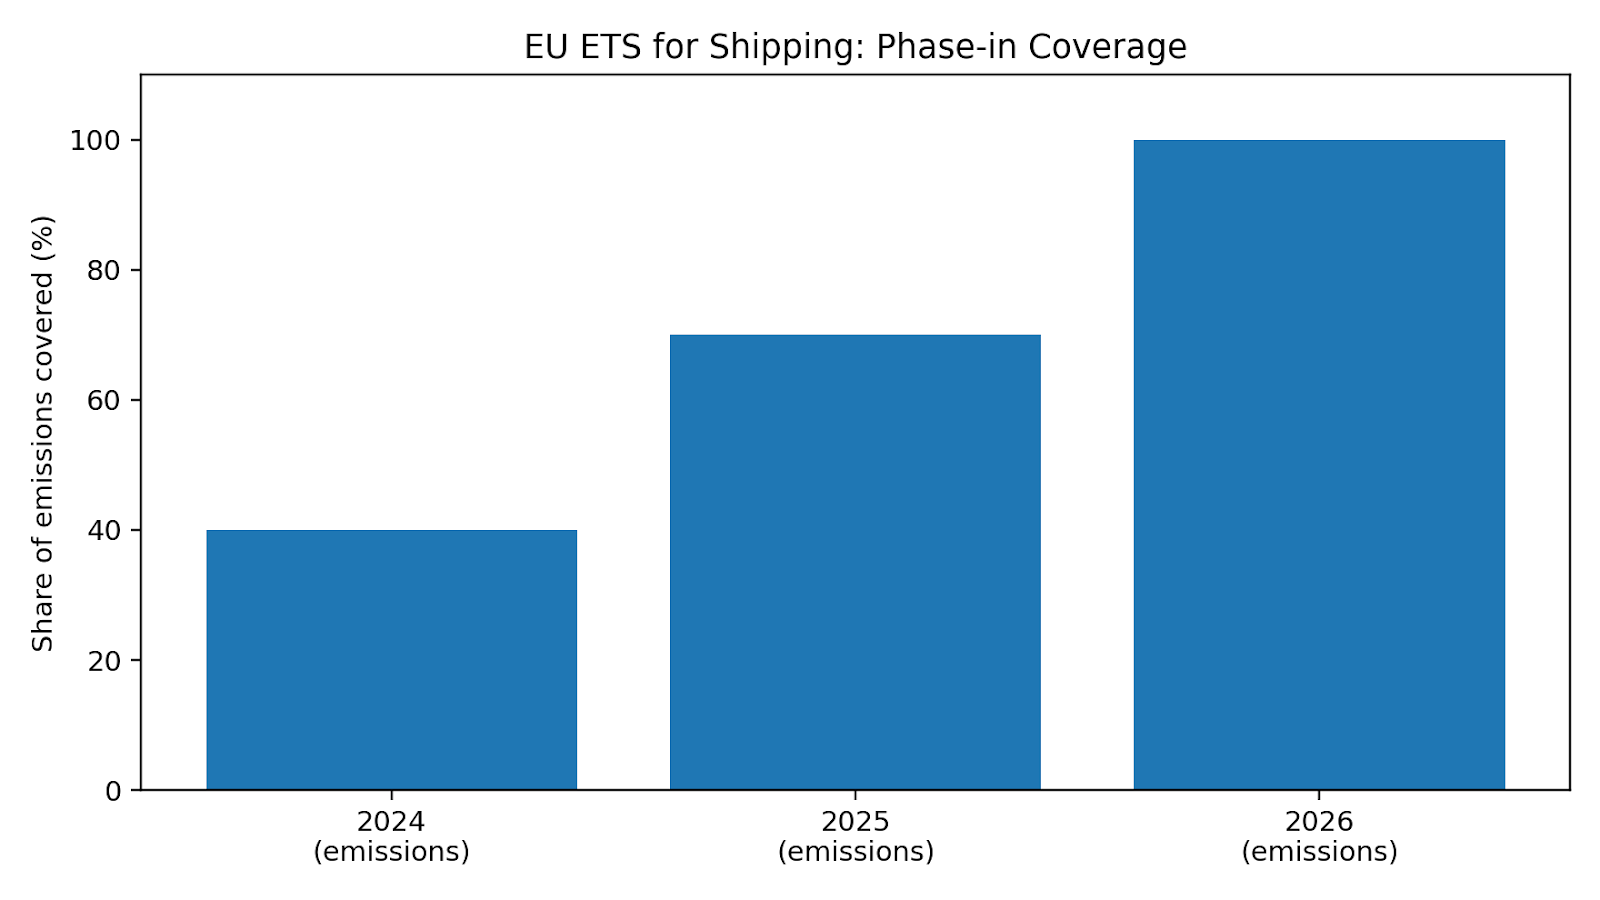
Source context: DNV summarizes the phase-in as 40% (2024) → 70% (2025) → 100% (2026).
Why it matters strategically:
If emissions costs ramp year by year, then “minor” operational improvements (speed plan discipline, port wait reduction, hull cleaning timing) become compounding financial advantages, not just technical wins.
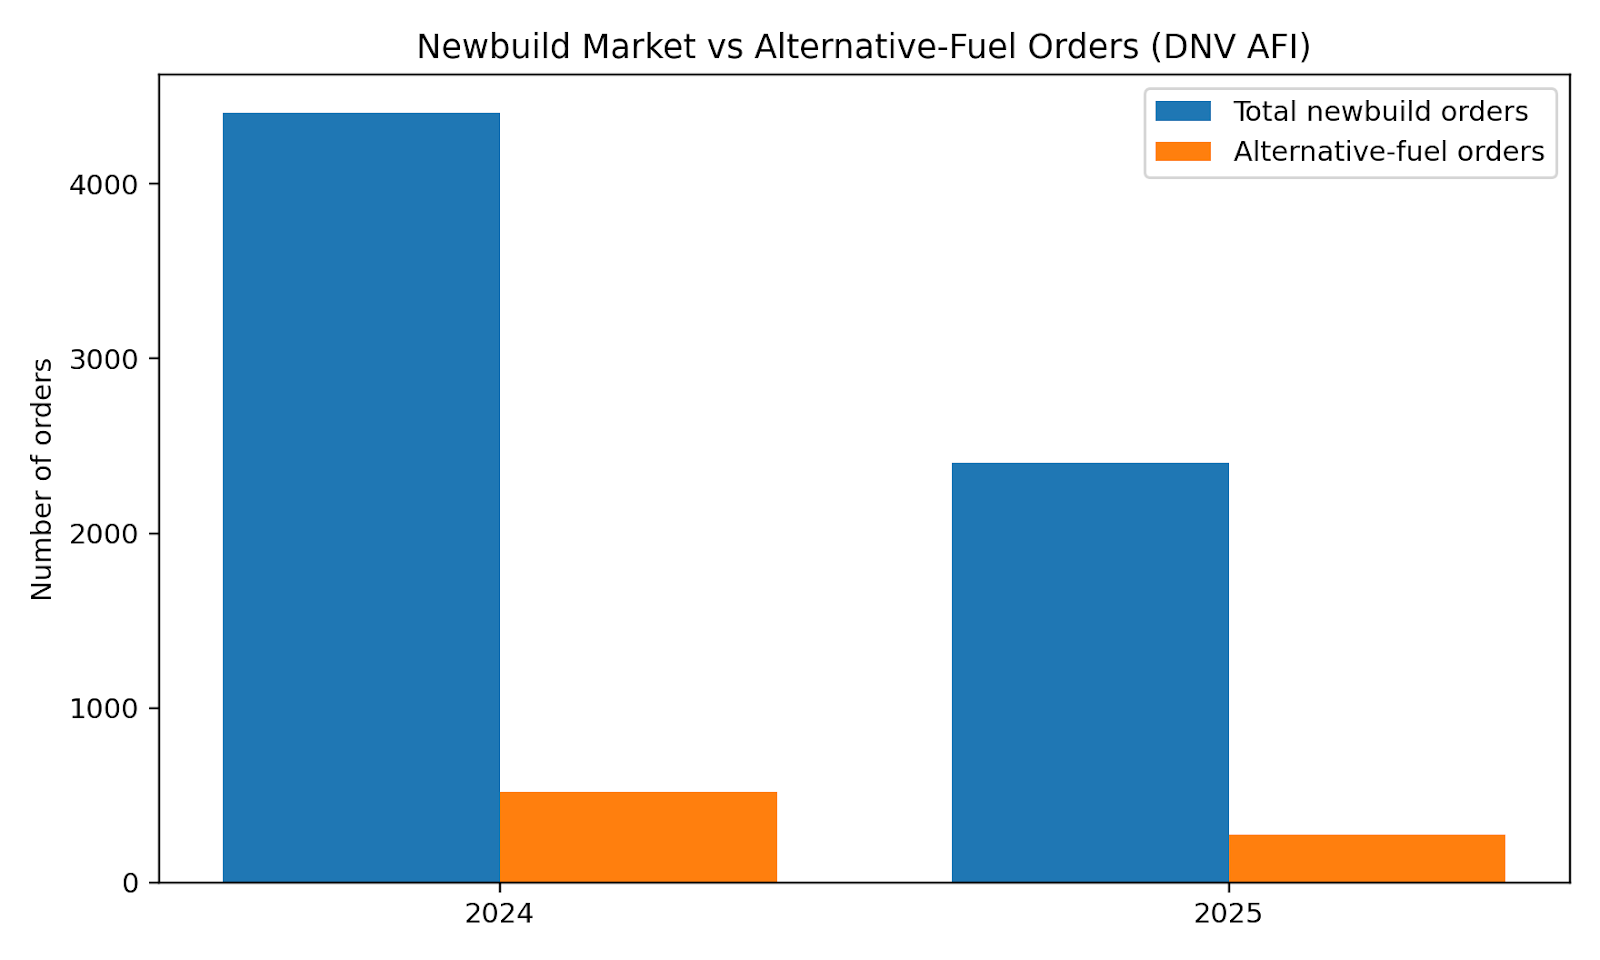
Built using DNV’s reported order totals (2024 vs 2025) and alternative-fuel orders for 2025, with 2024 alternative-fuel orders inferred from DNV’s “47% decrease” statement.
How to use this in fleet strategy discussions:
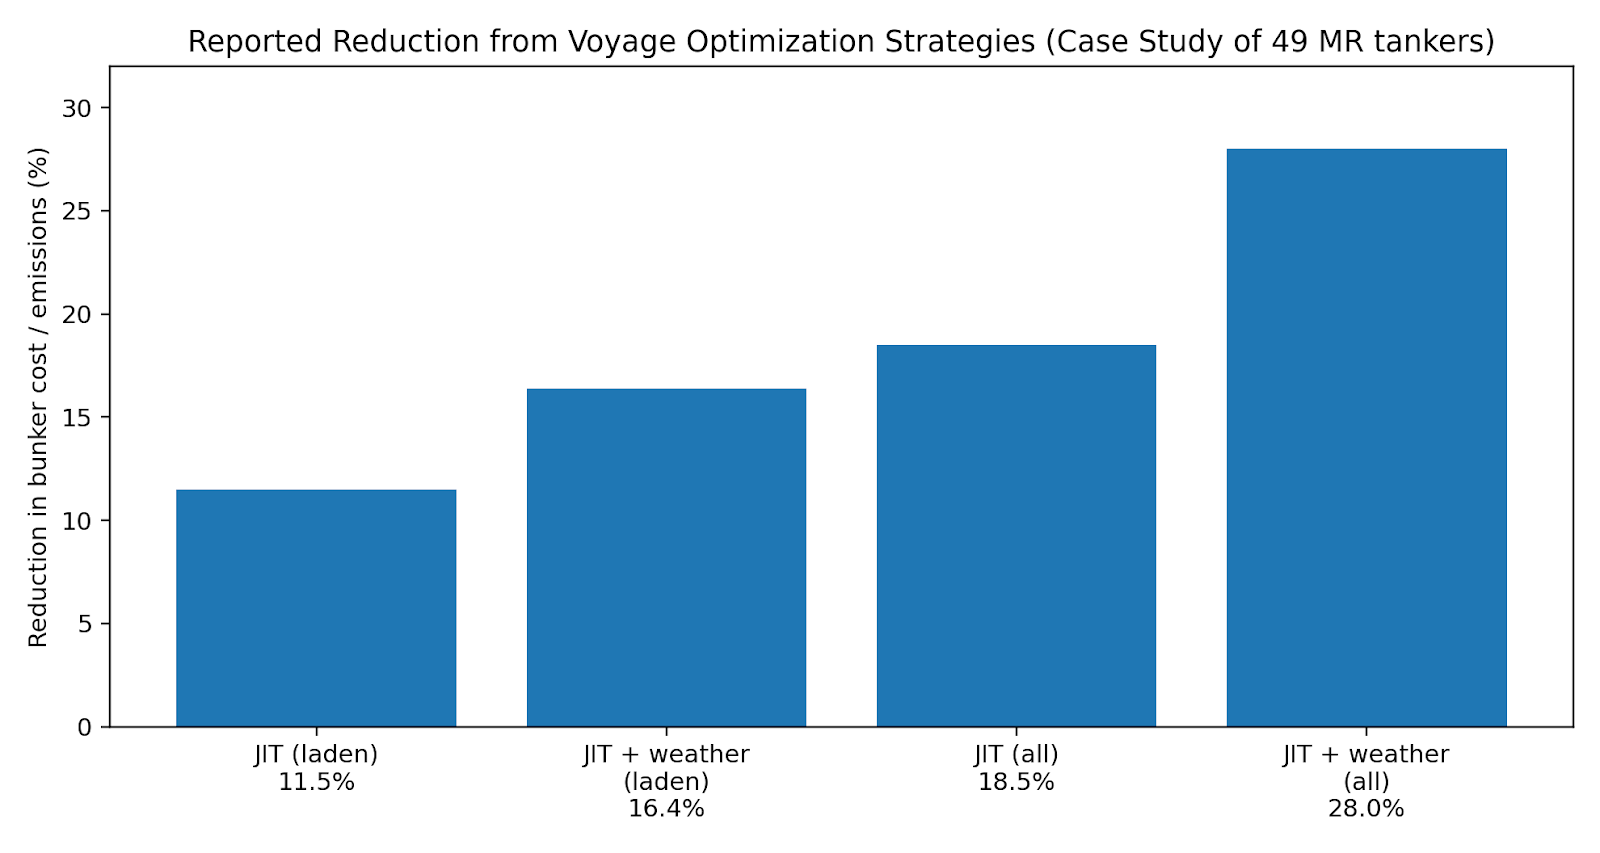
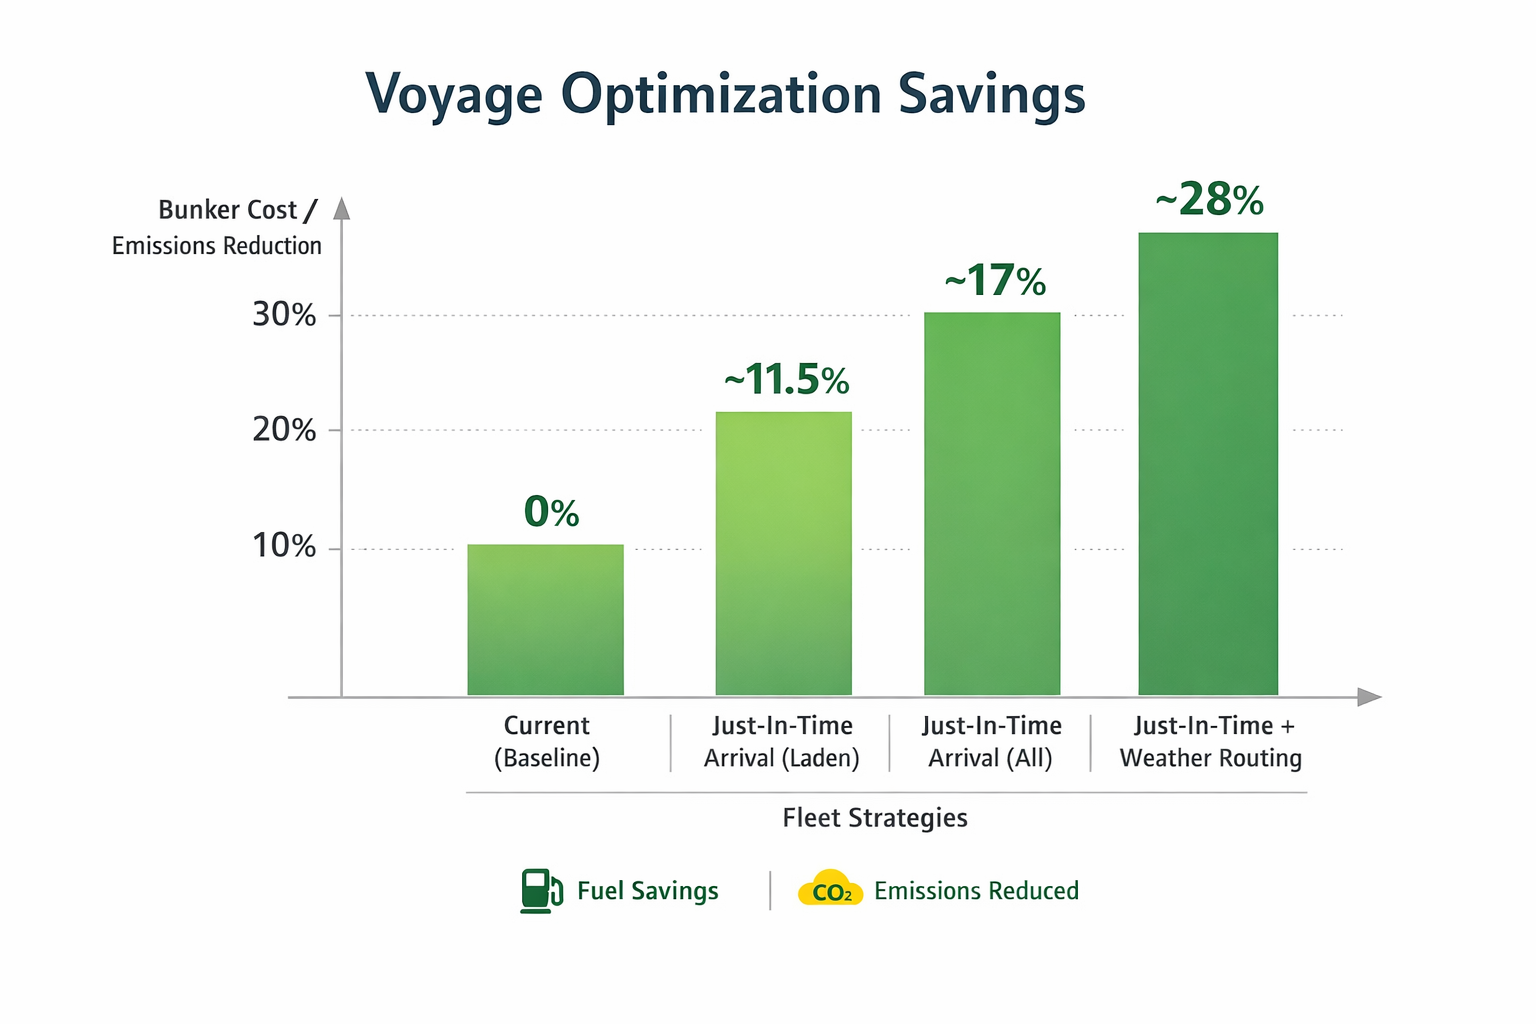
This chart uses a shipping case study (49 MR tankers, AIS + weather + performance modeling) reporting reductions with just-in-time arrival and weather routing strategies, ranging from ~11.5% up to ~28% in bunker cost/emissions depending on scope and assumptions.
Strategic takeaway:
Voyage analytics is not just “route planning.” When scaled fleet-wide, it becomes a direct lever on:
A huge amount of hidden cost comes from arriving early and waiting: fuel burned to make the ETA, then days lost at anchor. Analytics changes this by turning the voyage into a controlled “arrival window” problem.
A detailed case study of voyage optimization using AIS data and simulation reports:
Strategic fleet decision impact:
Retrofits are strategic because they affect payback, resale, and route competitiveness.
A Wärtsilä case study describes two Vitol-managed tankers using propulsion efficiency solutions and reports 6% annual fuel consumption savings, described as equivalent to “16 days of free fuel per year” for a vessel operating 260 days/year.
Strategic decision impact:
The best chartering decision is often made before the voyage starts—by selecting the right hull for the job.
A published industry example describes analytics enabling a charterer to rank vessels, identify top/bottom performers, and reconsider chartering decisions, reporting large financial savings after prioritizing efficient vessels and maintenance actions.
Also, academic work explicitly frames AIS analytics as supporting strategic decision areas such as chartering and vessel operation, with the key message that AIS becomes more powerful when enriched with other data sources.
Strategic decision impact:
With EU ETS phase-in, emissions cost exposure grows year-by-year.
Strategic question: Which trades and vessels will become “cost heavy” under emissions pricing, and what is the cheapest mitigation?
Analytics answers by modeling:
Why this changes decisions:
DNV reports that ordering activity fell sharply in 2025, while alternative-fuel orders still represented a meaningful portion of the orderbook even amid the slowdown.
Meanwhile, Reuters reporting cites industry forecasts that LNG bunkering volumes could surpass 4 million tons by end-2025 and double by 2030, and references DNV counts of LNG dual-fuel vessels now and expected by 2030.
Strategic decision impact:
The Sea Cargo Charter frames emissions data transparency as enabling chartering decisions with clearer understanding of climate implications.
Even if you’re not a signatory, the strategic pattern is important:
Here’s a practical view of the data you combine:
AIS analytics literature notes that AIS alone is often not enough; it becomes much more useful when enriched with other sources.
Bad analytics starts with “What can we measure?”
Good analytics starts with “What do we need to decide next?”
Examples:
Avoid 50 KPIs. Pick 8–12 that map to real decisions:
A decision-support output should look like:
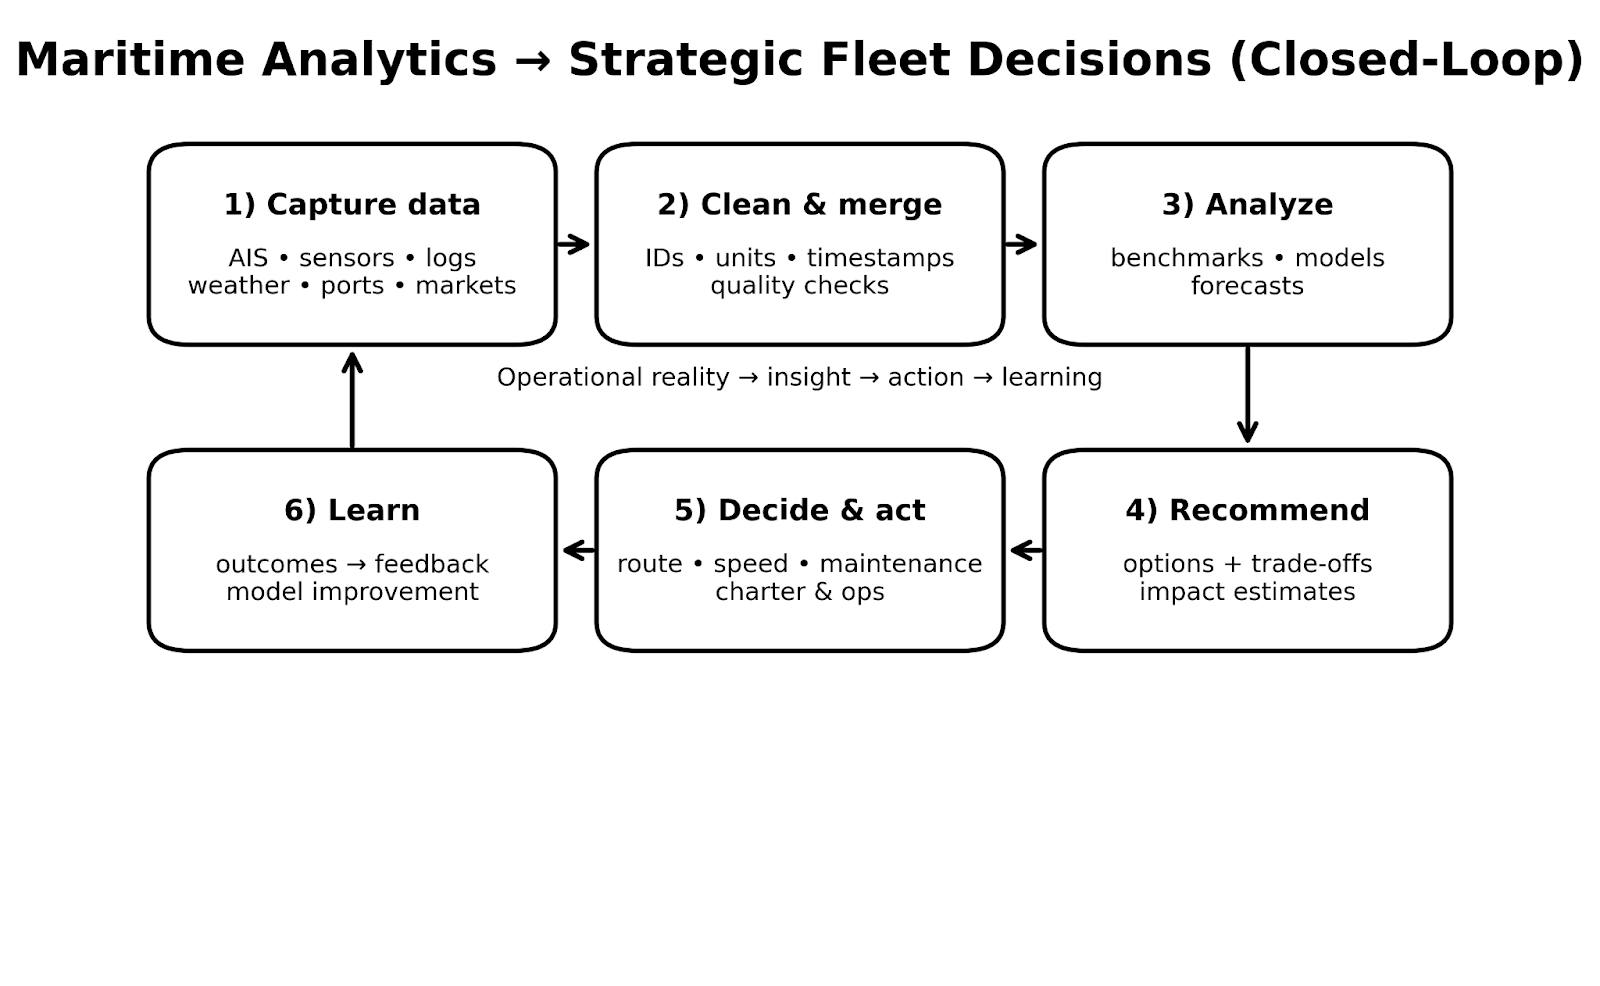
The most important part: after a decision, track results and feed them back into the model.
That closed-loop approach is what turns analytics from “reports” into “strategy.” (See Figure 4.)
This blog highlights that in the high-stakes, high-variance world of maritime operations, "gut feel" is no longer a viable strategy for fleet management. By transforming fragmented data—from AIS and weather to engine health and emissions regulations—into "decision-grade insight," analytics enables leaders to move beyond simple reporting toward prescriptive choices. Whether it is optimizing just-in-time arrivals to slash fuel costs by up to 28%, ranking charter vessels by actual route performance, or navigating the financial complexities of the EU ETS phase-in, analytics has evolved from an operational tool into a core strategic engine.
Elevate your fleet strategy with SmartSeas.ai. Our platform bridges the gap between raw data and actionable intelligence, helping you optimize deployments, minimize emissions exposure, and make data-driven maintenance and chartering decisions that directly protect your bottom line.
Start with port wait + just-in-time arrival + fuel normalization because it touches cost, schedule reliability, and emissions at once. Voyage optimization case studies show meaningful reductions when done systematically.
Not always. AIS + voyage + port call + noon report data can already support chartering insights and operational assessment, especially when enriched with other sources.
Tie analytics to decisions: “What will we do differently next week?” If the answer is “nothing,” remove the metric.
They turn emissions into forecastable cost exposure. EU ETS phase-in is a clear example of costs ramping over time, making early efficiency improvements financially strategic.
Use real orderbook trends (e.g., order volumes, alternative-fuel share, segment patterns) plus route feasibility and fuel availability forecasts to stress-test scenarios. DNV’s orderbook updates are a useful benchmark signal.

Get Started Today
Transform the way you troubleshoot and manage maritime operations. Join the next wave of Maritime Digital Transformation with SmartSeas AI.